A structured report, not another set of views.
Looking through five screens is how you find out.
- Hiring concentration
- Pay by role and band
- Policy and peers
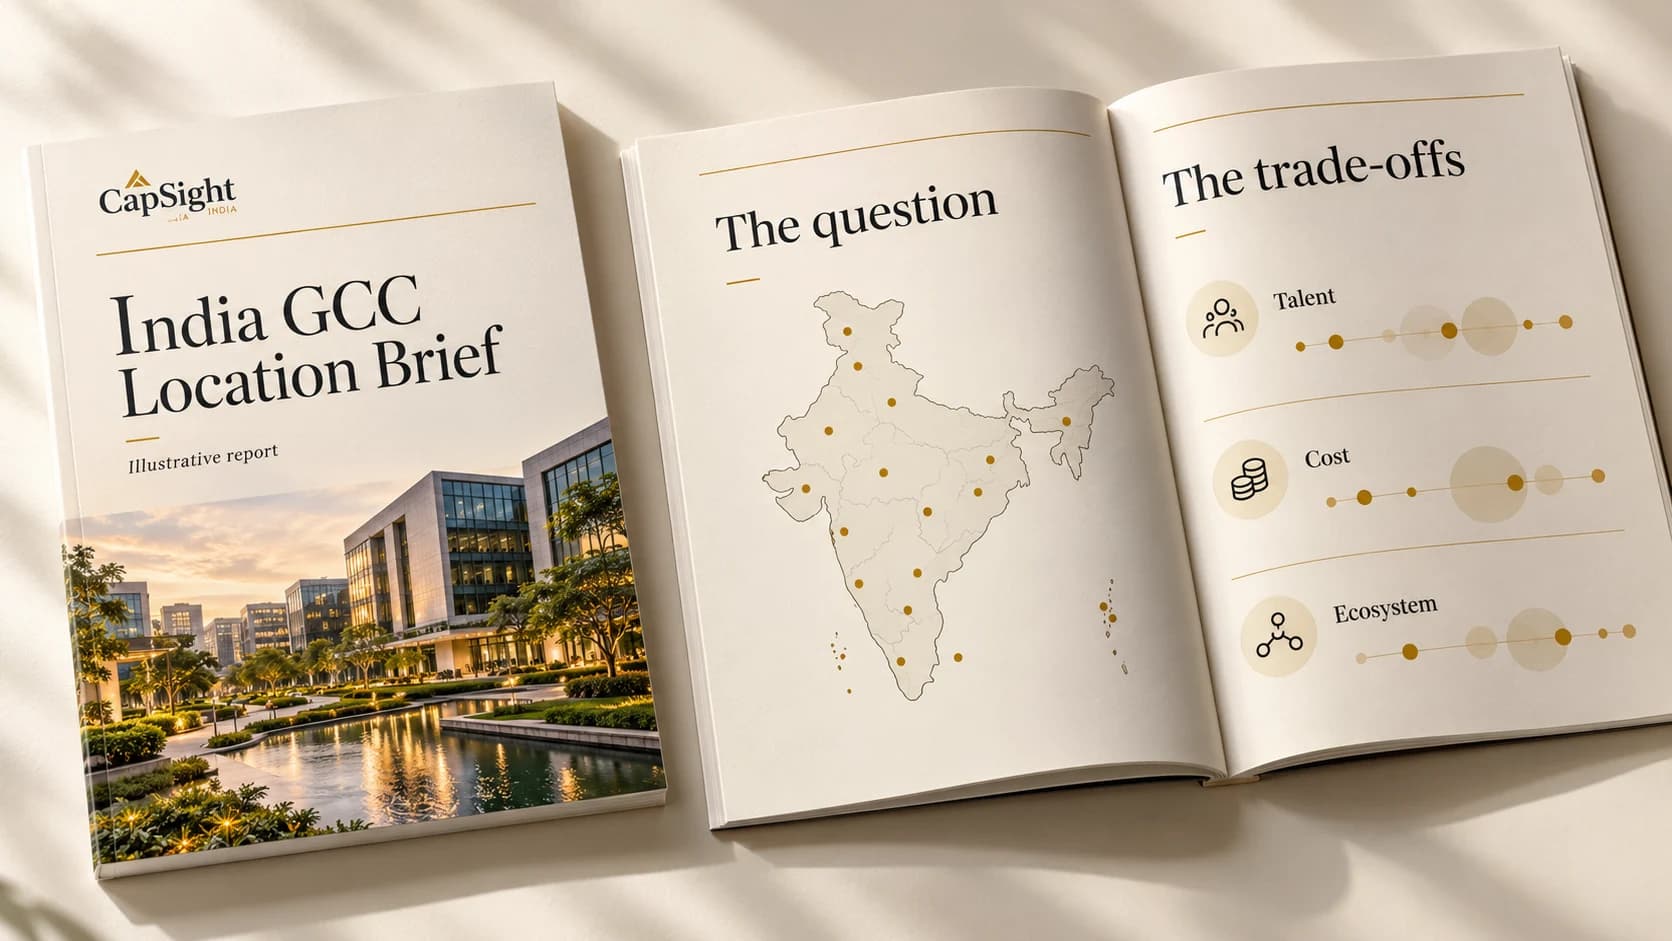
Illustrative report design · no client findings shown
Which of Pune, Hyderabad and Chennai should we shortlist for a data engineering centre?
2-minute reports · location brief
Compare cities before you recommend one.
From question to document
Which of Pune, Hyderabad and Chennai should we shortlist for a data engineering centre?
A useful brief keeps the comparison consistent. Read each city through the same role, experience and policy lens.
- 01
Hiring concentration
Compare hiring activity across the cities in scope.
- 02
Pay by role and band
Keep role and experience level consistent across locations.
- 03
Policy and peers
Read state terms beside the peer centres already operating there.
Location comparison brief
Pune · Hyderabad · Chennai
- The question
- Scope, roles and experience band
- The comparison
- Hiring, pay, policy and peer footprint
- The read-out
- Trade-offs and evidence gaps
- The source trail
- Where the figures came from
Illustrative contents · no city ranking or client findings shown
Read the evidence
See what the product puts in front of you.
Choose a view to inspect. These are product captures; demo-data views are marked.

- 2,557
- company profiles
- 33
- Indian cities with a centre
- 28
- documented build journeys
- 1,297
- companies with pay benchmarks
- Intelligence fields per company
- 300+
- Multidimensional company, workforce, hiring and market intelligence
- Compensation data points
- 1M+
- Salary and compensation observations
- Leadership profiles
- 500K+
- Senior professionals and leadership intelligence
- Companies with benefits intelligence
- 500+
- Employer benefits and rewards information
Go deeper
The detail behind the decision.
Open a chapter for the full context, the evidence to inspect and the limits of the view.
Chapter 01
Looking through views is not the same as having an output
Know when to keep exploring and when to produce the document.
Read this chapter
The product lets you look at a company, a city or a role from many sides. That is the right way to find an answer and the wrong format for handing one to someone else. A person who was not in the session needs the finding, the evidence and the sources in an order they can follow.
Two ways of using the same evidence
Both read from the same figures; they serve different readers.
- Looking through viewsYou are finding the answerHaving the reportYou are presenting the answer
- Looking through viewsMany screens, many filtersHaving the reportOne document, in an order
- Looking through viewsRead by youHaving the reportRead by people who were not there
- Looking through viewsFigures live on the screenHaving the reportFigures with a source line each
Chapter 02
Describe what you need
Turn a request into a defined report without filling in a form.
Read this chapter
Write the question the way you would brief a colleague: a location decision between three cities, the talent market for a role, a benchmark of one company against its peers. CapSight reads it into a brief with the choices visible and editable: the companies, the cities, the roles, the depth.
Chapter 03
Approve the plan before anything is built
Stay in control of what the report says it covers.
Read this chapter
You see what will go into the report and change it before it is made. Nothing builds until you confirm. Depth is yours to set: a snapshot for a quick read, an executive brief for a meeting, a deep dive for a decision.
Chapter 04
What a report can cover
Pick the areas that match the discussion you are walking into.
Read this chapter
Standard areas, which can be combined in one document:
- Company benchmark and peer comparison
- Talent market for a set of roles
- Compensation: percentiles by role, city and band
- Location: a city or state weighed against the decision
- Capability: a function compared with its peers
- GCC landscape for an industry or a region
- Workforce: size, mix and hiring
Chapter 05
Pages built to be read
Hand over a document that has already been laid out and sourced.
Read this chapter
A cover, a summary, then the evidence on designed pages with charts, tables and a written read-out, and a closing page. Each figure has a line saying where it comes from, so a number in the report can be traced to the data behind it. Download it as a PDF or as a PowerPoint you can edit.
The report is evidence for a decision. It does not make the decision, and it does not replace the advice of a consulting firm or your own judgement.
Chapter 06
Where it gets used
Pick the report for the meeting that is on the calendar.
Read this chapter
Internal reviews and leadership discussions. Client meetings. Business cases. Location decisions. Talent discussions. Benchmarking against a peer set. Competitive reviews. The same report can be rebuilt when the question moves.
Questions this evidence can answer.
- 01
Which of Pune, Hyderabad and Chennai should we shortlist for a data engineering centre?
- 02
What does the talent market for senior cloud engineers look like in Bengaluru?
- 03
How does our centre benchmark against its five closest peers?
- 04
What do GCCs pay for these twelve roles in each of our shortlisted cities?
- 05
What is the GCC landscape in healthcare, by city?
Coverage and limits
What is held today, and what is still next.
Held today
- Reports built from a written brief, with a plan to approve first
- Snapshot, executive brief and deep-dive depths
- Designed pages with a cover, summary, evidence and closing
- A source line under every figure
- PDF download and editable PowerPoint
- A library of the reports you and your organisation have made
- Evidence from 2,557 company profiles, pay percentiles, hiring and locations
Coming next
- Scheduled refresh of a saved report
- Branded templates for your organisation
- More report types for specific functions
7 held today · 3 coming next
Definitions for this view
The terms on this page, defined.
Every figure on a CapSight page comes with its definition, so you never have to guess what a number is counting.
- GCC
- A Global Capability Centre: a centre a company runs in India for its own global work, such as engineering, analytics, finance, operations or support. It is part of the company, not an outside vendor.
- Platform Industry
- The one industry grouping CapSight uses for every company, so a filter or a chart means the same thing on every page. There are 10.
- Tier 1 and Tier 2 cities
- Tier 1 is the eight established hubs: Bengaluru, Chennai, Hyderabad, Mumbai, Pune, Delhi NCR, Kolkata and Ahmedabad. Every other city is Tier 2.
- Designed report
- A report laid out as a finished document, with charts and a written read-out, that you can open, download and present, not a table export.
- Source line
- The note under a figure that says where it comes from, so a number in a report can be traced back to the evidence behind it.
- Report depth
- A snapshot is a quick read, an executive brief is written for a meeting and a deep dive is written for a decision. You choose the depth before anything is built.
Take the next step
Describe the report you need.
If the question does not fit a standard report, commission it as Custom Research.