How strong is this capability here, against the right peers?
Every GCC says it is building AI, data or cybersecurity.
- Scale and concentration
- Skills and seniority
- Hiring momentum

Inside the product · a capability peer brief
Is the gap in our data capability one of depth, seniority, or skills?
Open full-size viewCapability benchmarking / peer comparison
Capability strength needs depth, skills, and context.
A comparison worth making
Depth is different from breadth.
| Evidence | Read the depth | Read the breadth | Keep in context |
|---|---|---|---|
| Workforce | People in the capability | Share of the centre | Peer size and function |
| Skills | Cluster concentration | Range of skills | Adjacent skill gaps |
| Seniority | Experienced specialists | Levels represented | Role accountability |
| Hiring | Concentration of open roles | Functions being added | The same comparison period |
Read the target and peer median through the same capability, scope and time period.
Read the evidence
See what the product puts in front of you.
Choose a view to inspect. These are product captures; demo-data views are marked.
 Sample data
- 2,557
- company profiles
- 2.99M
- people in GCCs across India
- 46
- mega GCCs, over 10,000 people
- 33
- Indian cities with a centre
- Skills mapped
- 60,000+
- Technical, functional and emerging skills
- Roles mapped
- 5,000+
- Standardised job roles and specialisations
- Business functions mapped
- 10+
- Technology, finance, operations, HR and other business functions
- Intelligence fields per company
- 300+
- Multidimensional company, workforce, hiring and market intelligence
Go deeper
The detail behind the decision.
Open a chapter for the full context, the evidence to inspect and the limits of the view.
Chapter 01
Choose a capability and the right peers
Set the comparison the way a leadership team would argue it.
Read this chapter
Pick the capability you are assessing, such as AI and machine learning, engineering, data, product, cybersecurity, finance, operations, HR or supply chain, then a target company and up to four peers. Peers can be the companies in the same industry, of similar size, or the ones that you name.
Chapter 02
How much of it is there?
See who actually runs the capability at scale.
Read this chapter
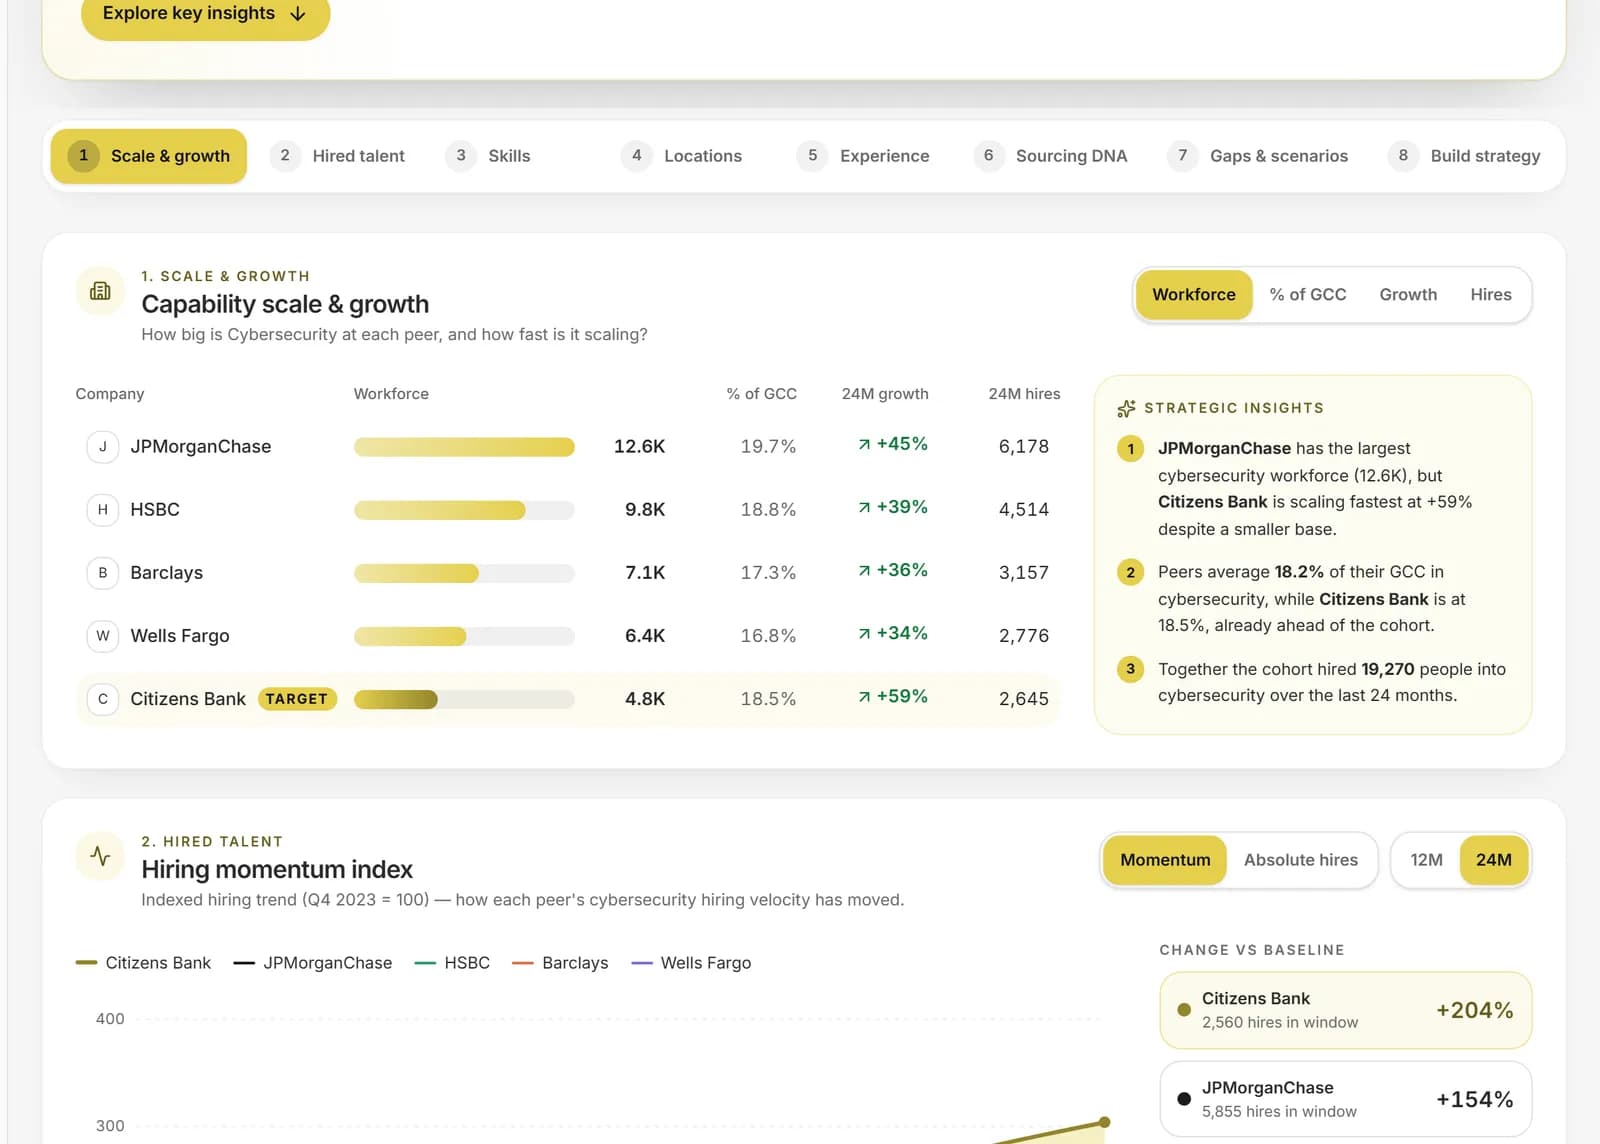
Workforce in the capability, its share of the centre and how it has grown. Depth is shown separately from breadth, because fifty people in one team is not the same capability as fifty spread across five.
Chapter 03
Which skills, and how senior?
Find the gaps that headcount hides.
Read this chapter
Skill clusters against the peer median show where a centre is ahead and where it is thin. Seniority shows whether the capability is led by experienced people or sits at the junior end. Neither one is visible in a headcount.
Chapter 04
Who is building it fastest?
Separate the centres that are building from the ones that are holding.
Read this chapter
Hiring momentum over twelve or twenty-four months, by capability. A centre with a small team that is hiring quickly is a different competitor from a large one that has stopped.
Chapter 05
The read-out
Take a finding into a leadership discussion without rewriting it.
Read this chapter
Each comparison comes with a read-out in plain words: where the target is strongest, where it trails the peer median, and what to look at next. The comparison can be exported as a dossier for the discussion it is for.
Questions this evidence can answer.
- 01
How does our data and analytics team compare with the four closest GCCs in our industry?
- 02
Which peer is hiring fastest in cybersecurity, and at what seniority?
- 03
Which skill clusters are we thinnest in against the peer median?
- 04
Which GCCs have built the largest AI and machine-learning teams, and how senior are they?
- 05
Is the gap in this capability one of depth, of seniority or of skills?
Coverage and limits
What is held today, and what is still next.
Held today
- Comparison of a target and up to four peers by capability
- Scale, share, growth and hiring momentum by capability
- Gap analysis by skill cluster against the peer median
- A plain-words read-out and dossier export
Coming next
- Capability figures drawn from the full live data (the screens carry sample figures until then)
- AI and machine-learning investment intensity
- More capabilities beyond the first set
4 held today · 3 coming next
Definitions for this view
The terms on this page, defined.
Every figure on a CapSight page comes with its definition, so you never have to guess what a number is counting.
- GCC
- A Global Capability Centre: a centre a company runs in India for its own global work, such as engineering, analytics, finance, operations or support. It is part of the company, not an outside vendor.
- Platform Industry
- The one industry grouping CapSight uses for every company, so a filter or a chart means the same thing on every page. There are 10.
- Tier 1 and Tier 2 cities
- Tier 1 is the eight established hubs: Bengaluru, Chennai, Hyderabad, Mumbai, Pune, Delhi NCR, Kolkata and Ahmedabad. Every other city is Tier 2.
- Operating centre
- A company's presence in one city. A GCC with centres in three cities has three, which is why centres outnumber GCCs.
- Signal
- A recorded change at a company, such as a new site, a hiring surge or an appointment, with its date and source. A signal is evidence of activity, not of what the company intends.
- Median and percentiles
- The median (P50) is the middle value: half the sample sits below it. Percentiles show the spread around it, so a median is never quoted without its band.
Take the next step
Compare your own centre with four others.
Name the capability and the peers, and read the gap.