Can this location support the decision we are making?
A city ranking tells you nothing about your plan.
- Talent depth
- Competition and cost
- Policy and peers

Inside the product · a state's operating picture
Can Coimbatore support a 250-person engineering centre in the next eighteen months?
Open full-size viewLocation and policy / test the operating plan
Choose a location against the roles you need.
Operating footprint
Start with the hubs already on the map.
Bengaluru · Hyderabad · Pune · Chennai · Delhi NCR
LOCATION BRIEF · STATE POLICY
Policy belongs beside market fit.
Capability and talent
Hiring competition and pay
Incentives and clearances
Document schematic · no policy terms or location scores invented.
Read the evidence
See what the product puts in front of you.
Choose a view to inspect. These are product captures; demo-data views are marked.
 Sample data
- 17
- states and union territories
- 33
- Indian cities with a centre
- 4,477
- GCC centres
- 2.99M
- people in GCCs across India
- States with policy coverage
- 12+
- State-level policy and incentive intelligence
- Daily expansion signals
- 100+
- Multi-source GCC establishment, expansion and capability signals
Go deeper
The detail behind the decision.
Open a chapter for the full context, the evidence to inspect and the limits of the view.
Chapter 01
State the decision first
Make the location question specific before comparing cities.
Read this chapter
Name the capability, the scale and the timeline, as a brief would. A first centre of two hundred engineers and a second site of eight hundred operations staff need different things from a city, and the page reads the location against whichever you have.
Chapter 02
Is there enough talent, at the experience you need?
Check the supply of the specific roles and levels, not just the population.
Read this chapter
Workforce by function and seniority, the experience bands present, the skills that are growing and where each peer's hires come from. Experience depth matters more than raw numbers for a senior or specialised team.
Chapter 03
Who else is hiring, and what does it cost?
Price the competition for talent in each city.
Read this chapter
Open roles in the city for your role families, how many centres are hiring for them and what the same role costs at each percentile. A city with plenty of talent and heavy competition for it is not the same as one with plenty and little competition.
Chapter 04
GCC density and capability concentration
Judge whether to be among peers or away from them.
Read this chapter
How many centres a city holds, how much of the workforce they employ, which industries and capabilities cluster there and how many peers you would sit among. Density helps with talent and costs with attrition; the page shows the evidence for both.
Chapter 05
Policy, incentives and the operating environment
Compare what each state offers against what it already has.
Read this chapter
A matrix of states by incentive policy, clearance times and subsidies, next to the state's workforce, industry mix and new-centre activity. Infrastructure and the office market are read alongside; lease cost per seat is in preparation.
What a state is read on
Policy never stands alone; each row sits beside the workforce it applies to.
- The questionIs the talent there?Where it is answeredWorkforce by function, seniority and skill
- The questionIs the competition manageable?Where it is answeredOpen roles and centres hiring in the city
- The questionWhat will it cost?Where it is answeredPay percentiles for the same role and band
- The questionWhat does the state offer?Where it is answeredIncentives, clearance times, subsidies
- The questionWho else is there?Where it is answeredPeers present, and recent new centres
Chapter 06
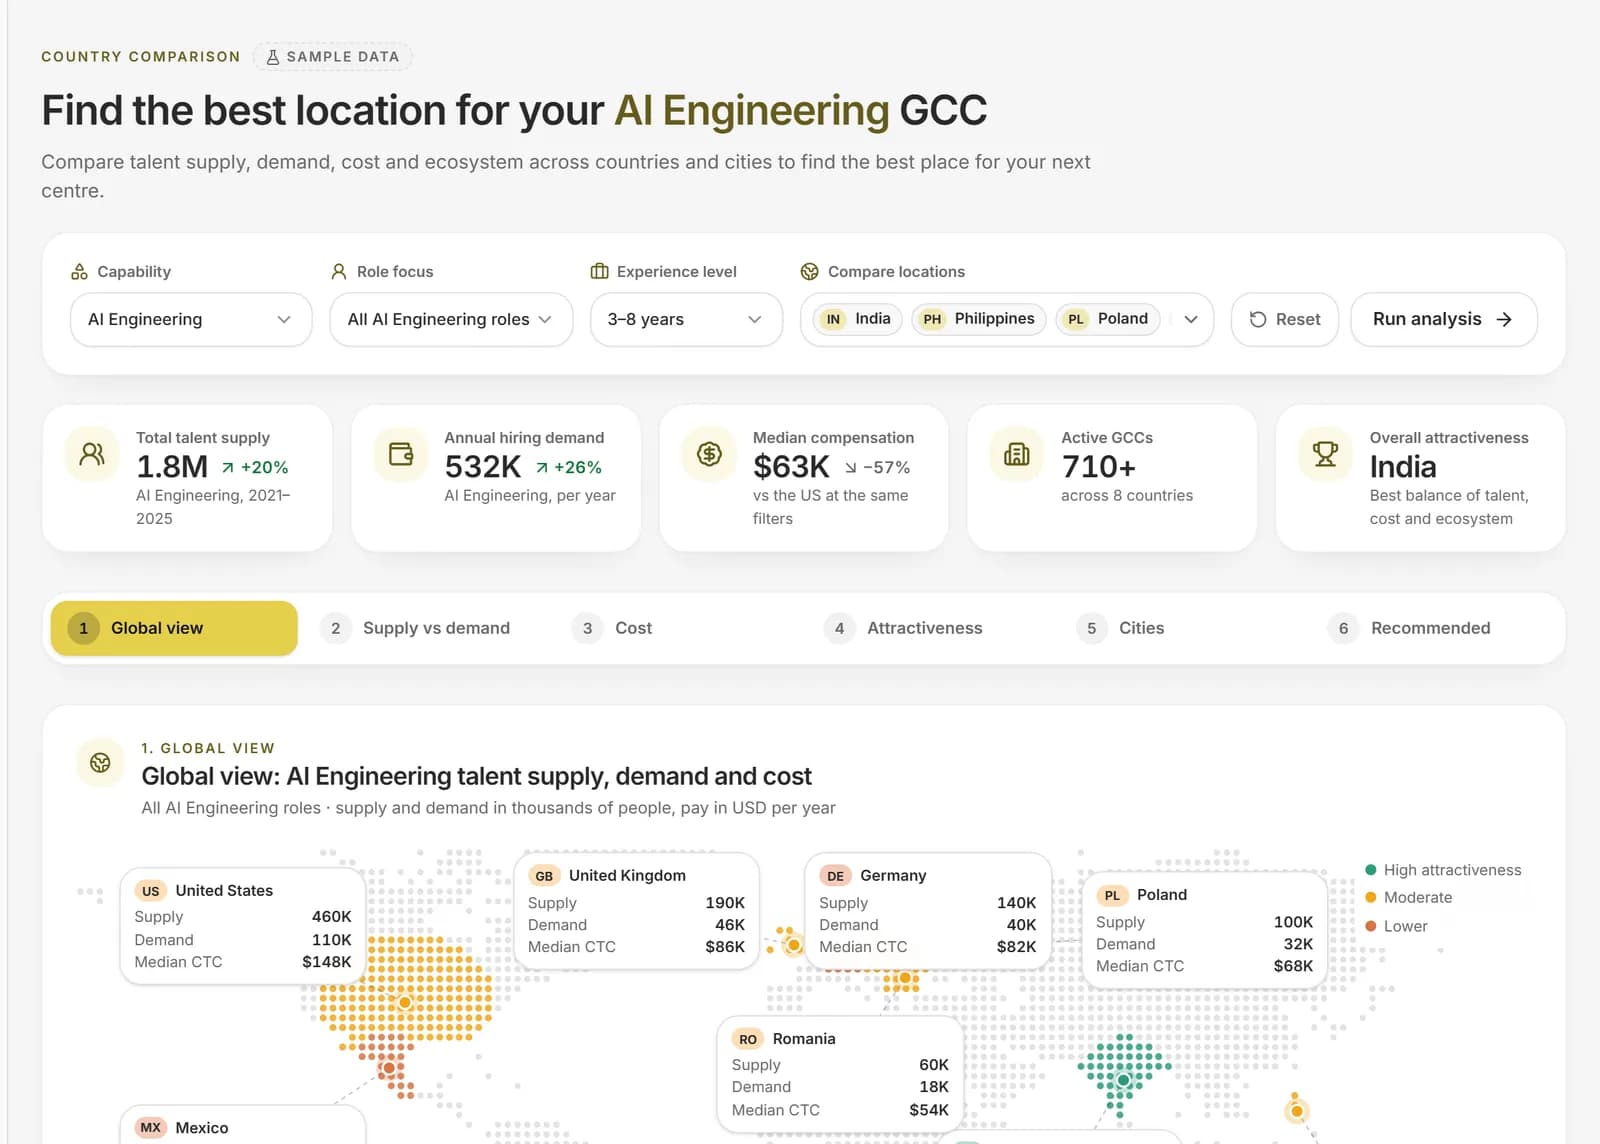
Beyond India
Set a decision about India against the alternatives abroad.
Read this chapter
For decisions between countries, supply, demand and cost are compared country by country for a capability, role focus and experience level, with the cities inside each country ranked. Country figures are sample data until the live feed replaces them, and the screens say so.
Questions this evidence can answer.
- 01
Can Coimbatore support a 250-person engineering centre in the next eighteen months?
- 02
Compare Bengaluru and Hyderabad on the roles we need to hire.
- 03
Which states offer GCC incentives, and how do their terms compare?
- 04
Where are mid-level cybersecurity professionals concentrated outside the established hubs?
- 05
How does India compare with another country for this capability?
Coverage and limits
What is held today, and what is still next.
Held today
- State and city profiles across 33 Indian cities with a GCC centre
- Installed workforce and centre counts by state and city
- Industry mix and parent-company regions for each state
- State incentive policy and statutory clearance timelines
- Hub and state comparison with annual pay for the same role
Coming next
- Office-market rents and lease cost per seat
- Policy change alerts
- Country figures drawn from live data (the screens carry sample figures until then)
5 held today · 3 coming next
Definitions for this view
The terms on this page, defined.
Every figure on a CapSight page comes with its definition, so you never have to guess what a number is counting.
- GCC
- A Global Capability Centre: a centre a company runs in India for its own global work, such as engineering, analytics, finance, operations or support. It is part of the company, not an outside vendor.
- Platform Industry
- The one industry grouping CapSight uses for every company, so a filter or a chart means the same thing on every page. There are 10.
- Tier 1 and Tier 2 cities
- Tier 1 is the eight established hubs: Bengaluru, Chennai, Hyderabad, Mumbai, Pune, Delhi NCR, Kolkata and Ahmedabad. Every other city is Tier 2.
- Operating centre
- A company's presence in one city. A GCC with centres in three cities has three, which is why centres outnumber GCCs.
- Signal
- A recorded change at a company, such as a new site, a hiring surge or an appointment, with its date and source. A signal is evidence of activity, not of what the company intends.
- Median and percentiles
- The median (P50) is the middle value: half the sample sits below it. Percentiles show the spread around it, so a median is never quoted without its band.
Take the next step
Test the cities you are weighing.
Put the question into words and read the evidence for each location, or turn it into a report.